Check out the latest performance statistics for the Gabriola ferry service
Analysis of monthly and quarterly operating statistics reported by BC Ferries to the BC Ferry Commission.
The charts compare performance across a number of measures, with 2019 (the last full year before travel was impacted by the COVID Pandemic) as a baseline to demonstrate both the impact of the Pandemic and the rate of recovery since 2021. BC Ferries’ monthly traffic statistics are published quarterly in July, October, January and April and will appear on this site as soon as they are available.
Copies of the tables, charts and graphs showing performance statistics up to March 31, 2024 can be downloaded in pdf format here
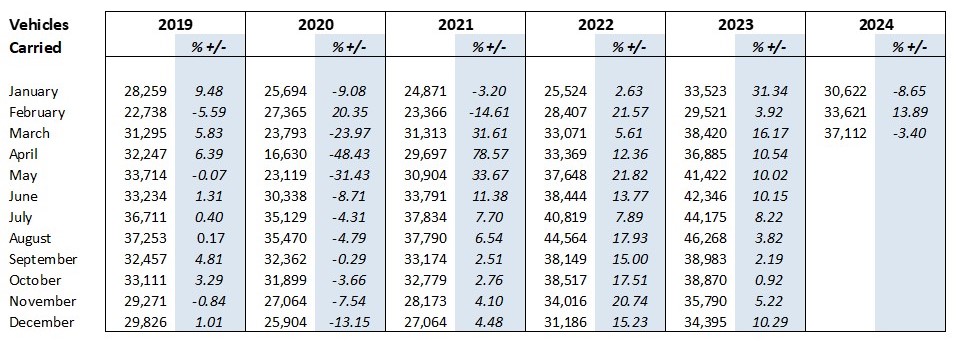
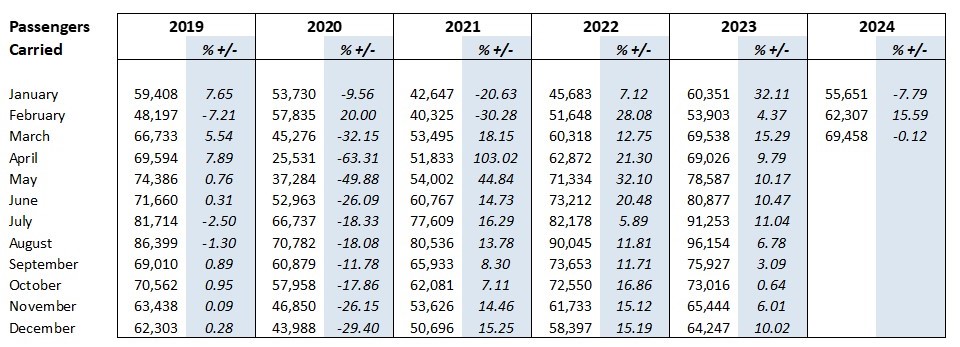
Monthly traffic reports (showing % change in traffic volumes from previous year)
These tables contain the actual number of vehicles** and passengers boarding the ferry at Nanaimo Harbour or Gabriola Island, therefore representing the number of one-way trips made.
** Other charts showing Capacity Utilisation convert these vehicle numbers into AEQs (Automobile Equivalents) reflecting the fact that larger vehicles will occupy more than one standard car length of deck space. The number of AEQs reported in any period will typically be between 6% and 7% more than the actual vehicle count, depending on the number of large commercial vehicles carried.
Monthly traffic statistics for other routes can be found on the BC Ferries website. Scroll down the page to select Traffic Statistics
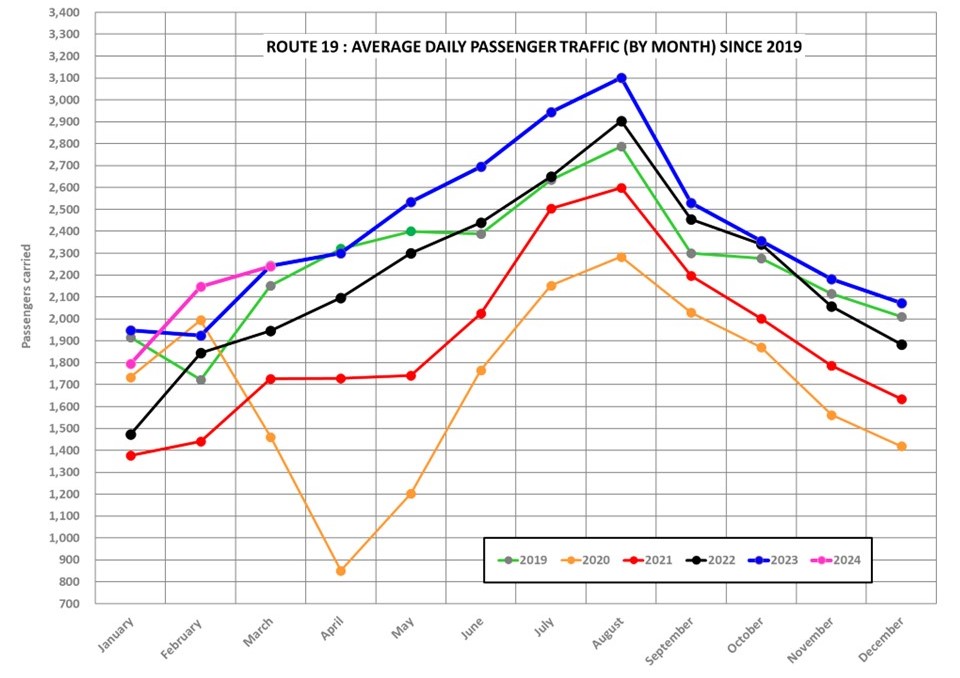
Average daily traffic – monthly comparisons
To account for the fact that the length of each calendar month varies between 28 and 31 days, these graphs depict the DAILY average number of vehicles or passengers travelling, to even out the different lengths of each calendar month and offer a more accurate representation of seasonal variations. These graphs also take account of the extra day that occurs in February each leap year, so data for 2020 and 2024 is adjusted to reflect 29 days instead of 28.

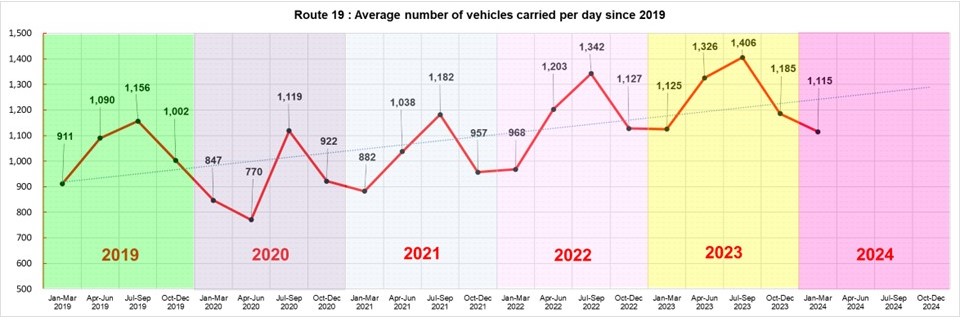
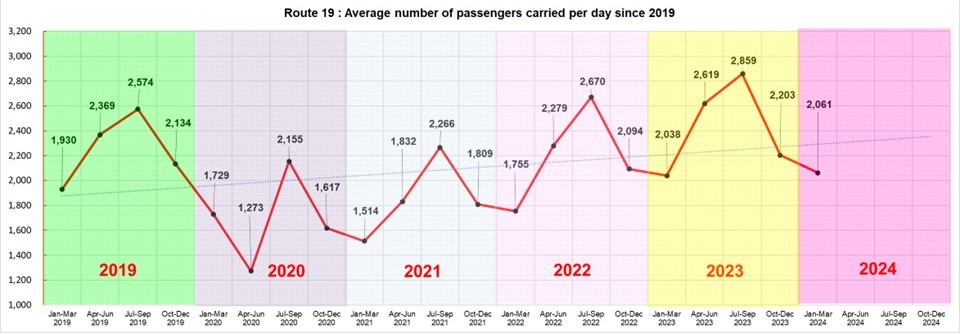
Quarterly performance since 2019 – Vehicles carried
This chart shows the actual number of vehicles carried, not AEQs.
Quarterly performance since 2019 – Passengers carried
Quarterly performance since 2019 – Vehicle capacity utilisation
This chart tracks the percentage of deck space utilised according to the Automobile Equivalent (AEQ) measure adopted by BC Ferries, based on each AEQ occupying 6.1m of deck space, giving the new Island Class vessels each a notional capacity of 47 AEQs.

Quarterly performance since 2019 – Sailing overloads
Sailing overloads are recorded either by terminal staff or by the Ship’s Master on board.

Quarterly performance since 2019 – On-time performance
Vessels departing within 10 minutes of the scheduled time are deemed to have operated on time.

Annual operating and financial performance for Route 19
Data from BC Ferries’ 2023 Annual Report to the BC Ferry Commissioner clearly shows the impacts of the introduction of the two-vessel operation in April 2022, which increased vehicle capacity by 18%. The number of vehicles carried has increased by 14%, (other minor routes have seen an average 4% increase) but the combined effects of more capacity at certain times of day and less at other times means that 11% of sailings continue to be overloaded. On-time performance has, however, improved significantly and has now returned to a level last seen in 2017.
In a year that saw BC Ferries’ operating costs increase by 12.6% overall, the additional resource of a second vessel on Route 19 resulted in operating costs rising by more than 50% and a doubling of depreciation and financing costs. Fares income (including social program reimbursement) grew by a more modest 13.8% over the same period, resulting in a funding gap that is twice that of last year, while government support has remained largely unchanged.


What do ferry users think of the service provided by BC Ferries?
The following charts show how customer satisfaction among ferry users on Route 19 has been affected by schedule changes and increasing traffic volumes.
Each of the charts tracks public reaction to the service cuts of Summer 2014 and the recovery in service provision from 2015 onwards, as well as the impact of increasing pressure on the ferry service as traffic has increased since 2015.
Data from the latest (2022) Customer Satisfaction Survey demonstrates that the introduction of an increased level of service with two smaller Island-Class ferries has had a significant impact on customers’ perception of the service, with satisfaction levels finally recovering to levels experienced before the service cuts in 2014.


